Manual
Login
Our 3D CAD supplier models have been moved to 3Dfindit.com, the new visual search engine for 3D CAD, CAE & BIM models.
You can log in there with your existing account of this site.
The content remains free of charge.

Top Links
Manual
 |
For AppServer Administration, call the PARTapplicationServer Dashboard.
PARTadmin -> category AppServer client -> dialog area Diagnostic -> click on
![[Note]](/community/externals/manuals/%24%7Bb2b:MANUALPATH/images/note.png)
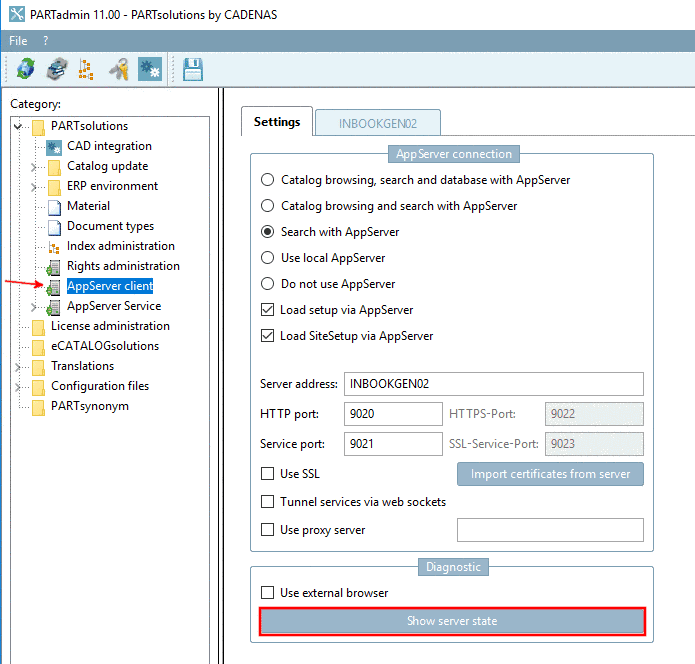
-> The PARTapplicationServer Dashboard is opened. (Directly after the first setup you can test the server's accessibility in this way.)

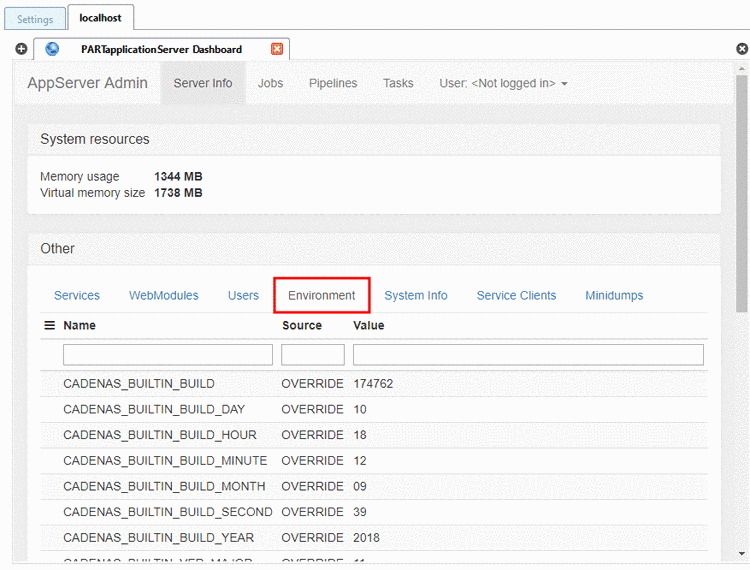
On the single tabbed pages you will receive a lot of information: Connected clients, via which modules, etc. You can check environment variables or view different server processes (Jobs), create tasks and administrate pipelines and more.
-
Environment: All environment variables of the server are displayed; for example CADENAS_DATA or CADENAS_LICENSE.
-
System Info: On the tabbed page System Info you can find the subcategories on AppServer services, installed file systems, installed catalogs, license information, Windows logs, Network information, OpenGL information.