Manual
Login
Our 3D CAD supplier models have been moved to 3Dfindit.com, the new visual search engine for 3D CAD, CAE & BIM models.
You can log in there with your existing account of this site.
The content remains free of charge.

Top Links
Manual
 |
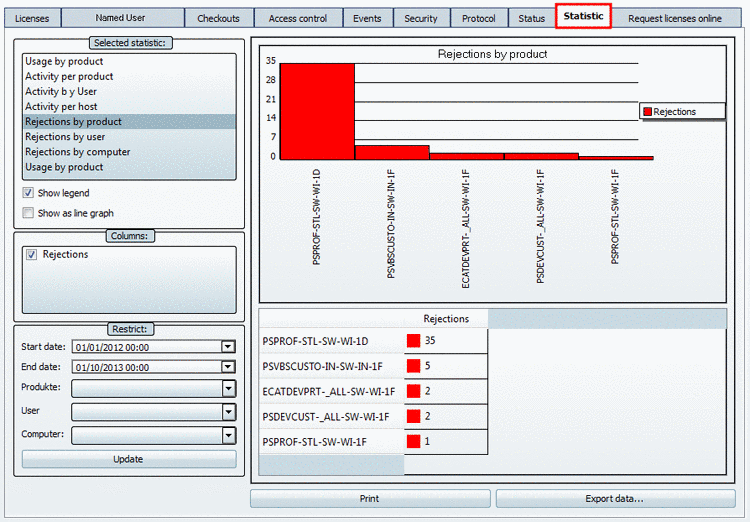
On the Statistic tabbed page there are different methods available for statistic evaluation.
![[Note]](/community/externals/manuals/%24%7Bb2b:MANUALPATH/images/note.png)
The single dialog areas and buttons
-
-
The statistic Usage by product lists the maximally available and used Floating licenses for all products within the defined period of time. If the number of In use (floating) licenses is very close to the number of available licenses, then you should consider the increase of capacity, even if there were no rejections yet. Also see the statistic types Rejections by product, Rejections by user and Rejections by computer.
This type of statistic is especially suitable for analyses over a longer period (month, year).


Under In use (floating) the highest value ever occurred is displayed.

Reserved licenses are a subset of the In use (floating) licenses.
On the Checkouts tabbed page you can administratively determine, whether users are allowed to checkout Floating licenses. Detailed information on this is found under Section 1.4.4.6, “ "Checkouts" tabbed page ”.
-
The checkout happens in the respective module under ? menu -> Licenses (F9) -> Checkout tabbed page. See Section 5.5.1.5, “"Checkout" tabbed page”.
Thereby the amount of available Floating licenses is reduced for the before defined checkout period.
So a Floating license can be reserved for a certain time, for a journey for example.

Used (sum): Is according to In use (floating). -
This statistic type is especially suitable for shorter periods of time, let's say 7:00 to 12:00 of a certain day. You can recognize the level of fluctuation, in relation to a certain product. High fluctuation confirms, that your decision for Floating licenses is correct.
License pulls and Shares are counting events in a certain time period. If the analysis period is unfavorably chosen (8:00 to 12:00 for example), while start of work is at 7:00 (now the licenses are pulled), the releases can be higher than the license pulls.


Rejections can only occur, when there is no license available anymore at the moment of request.
If there are rejections, then the amount of Floating licenses should be increased.
-
Analysis of user behavior. Many rejections? High fluctuation at license pulls and releases?
Rejections can only occur, when there is no license available anymore at the moment of request.
If there are rejections, then the amount of Floating licenses should be increased.
-
Similar analysis objective as with "Activity per user". Interesting when there are users with variable workplaces.
Rejections can only occur, when there is no license available anymore at the moment of request.
If there are rejections, then the amount of Floating licenses should be increased.
-
Rejections can only occur, when there is no license available anymore at the moment of request.
Rejections show that the amount of Floating licenses should be increased.
-
Rejections can only occur, when there is no license available anymore at the moment of request.
Rejections show that the amount of Floating licenses should be increased.
-
Rejections can only occur, when there is no license available anymore at the moment of request.
Rejections show that the amount of Floating licenses should be increased.
-
How many different users and/or computers use which product?
Is the number of computers higher than the number of users? This would show that there are users with variable workplaces.
-
-
An additional legend is displayed (also in print).
-
The depiction is changed from bar graph to line graph.
-
Depending on the chosen statistic the respective columns are displayed.
Hide not needed columns by clearing the checkbox.
-
Here you can filter with: Start date, End date, Products, User, Computer
In the list fields select the desired values. At Products, User, Computer you can select any number of values via checkboxes.
-
Right beside the setting options diagram and table view are displayed.
-
-
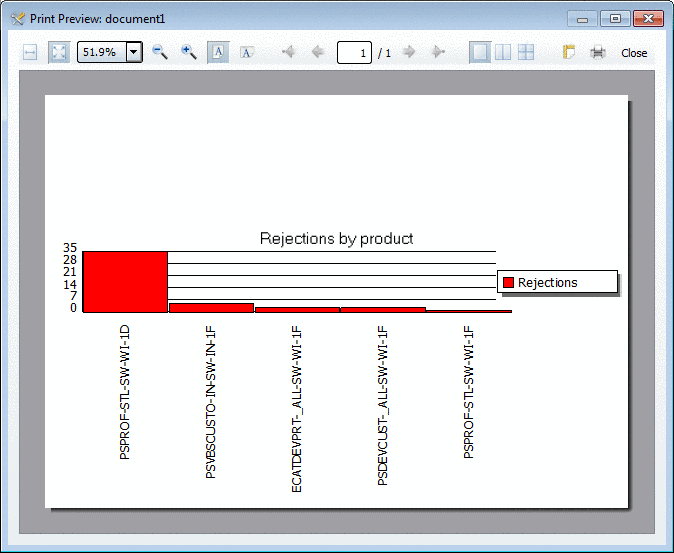
Print the result of the statistic evaluation.
-
Export the data of statistic evaluation in a CSV file. In this way you can process the data in other programs.
"Zeilenkopf","Abweisungen"
"PSVBSCUSTO-IN-SW-IN-1F",18
"PSDEVCUST-_ALL-SW-WI-1F",3
"PSPROF-STL-SW-WI-1D",3
"PDSTD-_ALL-SW-WI-1F",2
"ECATDEVPRT-_ALL-SW-WI-1F",1
"PSGEO-CAT4-SW-UX-1D",1
-