Manual
Login
Our 3D CAD supplier models have been moved to 3Dfindit.com, the new visual search engine for 3D CAD, CAE & BIM models.
You can log in there with your existing account of this site.
The content remains free of charge.

Top Links
Manual
 |
If graphics shall be shown at value range variables in addition then select the type Value range variable with graphics.
In the following, with the help of a little example, it is explained, how to create Value ranges with images:[90]
-
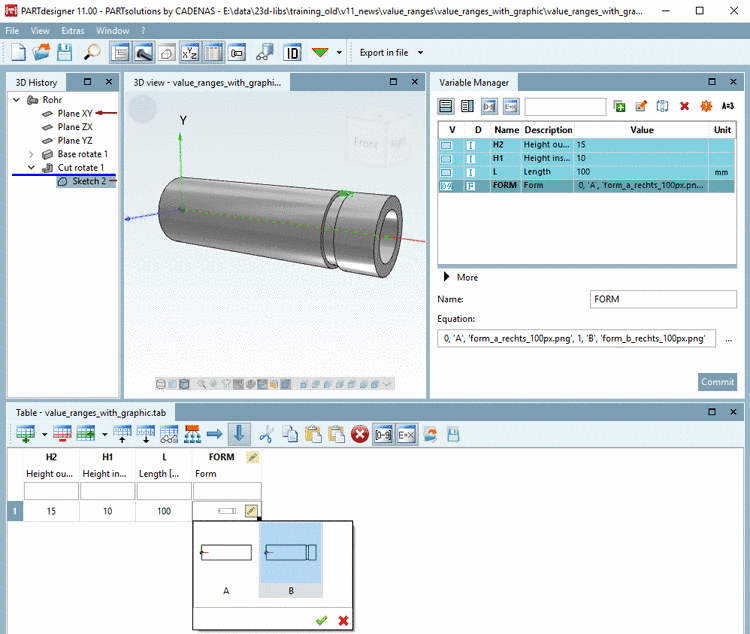
In the first step you create a value range variable in the Variable Manager. Here exemplarily FORM.
Create a variable with the respective parameters.[91]
-
Save location: Select In geometry and table.
-
Status: Select the option Value range variable with graphics.
-
Under Equation enter all parameters with correct syntax.
-
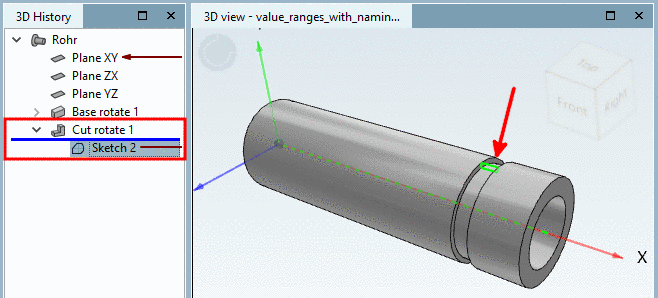
In the second step, in the Sketcher, create a sketch, which will be used for a "Cut".
-
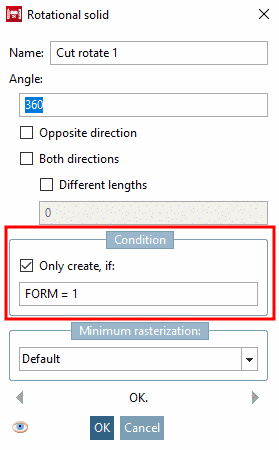
In the third step the cutting sketch gets a respective Condition, which creates the cut depending on the value selection of the variable FORM.
-
Test the functionality directly in PARTdesigner, in the docking window Table. (With the
 button, you can show/hide value range
variables.)
button, you can show/hide value range
variables.)Click into the value range field and select the desired value.
-
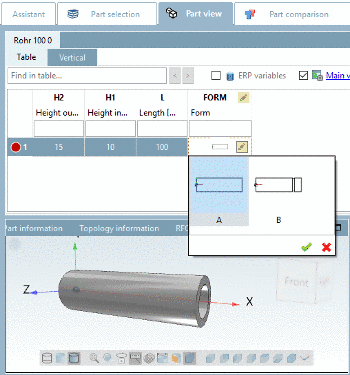
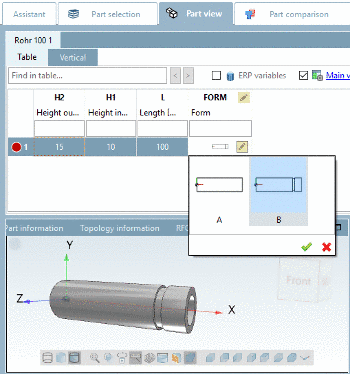
Just as well you can test in the PARTdataManager. Table view and value selection is identical as in the PARTdesigner.
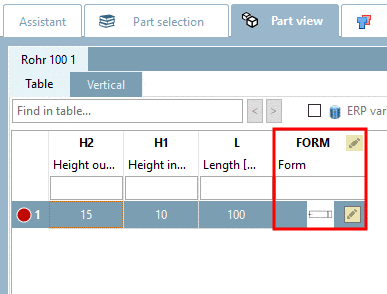
In the column FORM, click on the value range icon
 and choose the desired form.
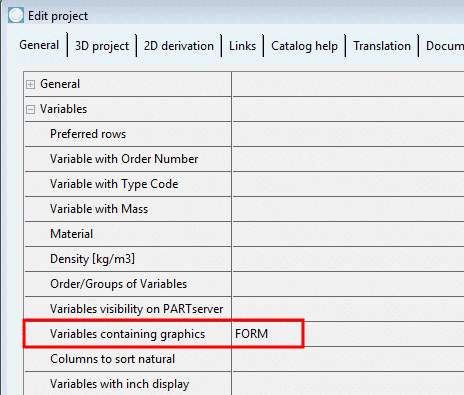
In a table column, you can optionally display graphics instead of text in PARTdataManager.
Precondition for this is, that in PARTproject, on the tabbed page General, in the block Variables, under Variables containing graphics, the respective variable name is entered (here exemplarily FORM).
With pressed Ctrl key and mouse wheel you can zoom graphics.

![[Note]](/community/externals/manuals/%24%7Bb2b:MANUALPATH/images/note.png)


[90] The adequate
example can be found in the "Training" catalog under \v11_news\value_ranges\value_ranges_with_graphic\value_ranges_with_graphic.prj.
[91] Basics on the procedure can be found under and Section 7.8.9, “ Variable Manager - The individual parameters”.
